
Making surveys in class is a great way to start making graphs. Write a question on the board like, "What is your favorite animal?" Then, list 4 or 5 animals. Have students come up to the board and they make a tally next to their favorite animal. Once all the data is in, make a picture or bar graph of the data from the board. Make sure you add the title to the graph and talk about how important the title of a graph is when interpreting the information. Students interpret that data and compare the results. Students will love looking and interpreting the data from their classmates. Here are some more questions that you can survey your students on:
- What is your favorite color?
- What is your favorite lunch choice?
- How do you get home?
- How tall are you?
- When was your birthday?
- What time do you go to bed?
- How many people are in your family?


Students can use a sheet of paper to create a graph or use the premade graph sheets included in this pack for students to write/draw the information from each task card. Students use basic math skills with small numbers they are comfortable with to complete the graphs.
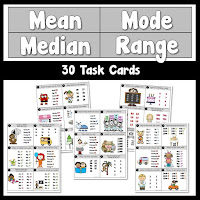
 I also have a set of 20 task cards of premade bar graphs. Students use the information in each bar graph to answer four questions. Students use the recording sheets to complete each task card. These are great for your math centers or during your small group time. These task cards are cute and colorful and will keep your students engaged while learning and reinforcing bar graph skills. These task cards are also great when preparing students for test prep. There are 10 task cards that show horizontal bars and 10 task cards that show vertical bars. Click the picture to learn more about these Bar Graph Task Cards.


Here are some resources you may need when teaching about graphs. I found some great deals on Amazon:
Write and Wipe Graph Charts
Graph Paper
Dry Erase Graph Boards
Graph Paper for Kids
Graph Charts
Bar Graph Pocket Chart
Table Chart Graph
The Great Graph Contest book
Thanks for stopping by today.
Happy graphing!
See you soon,


This comment has been removed by the author.
ReplyDeleteThis comment has been removed by the author.
ReplyDeleteThis is a good idea to contribute in student education essentials. I am very happy after reading this useful and helping blog. You are very right on the point of educating the coming generation using picture graph or bar graph. This formulae is a working and helping analysis for students picking ability. This process enhace the ranking of education in every country as an SEO Expert ranks his content for more appreciation and enhancement.
ReplyDeleteI really appreciate this type of topic which increases the information and knowledge of the readers. Graphing ideas and tools are really helpful to educate the upcoming generation but the nursing child care assignment writing services are also important for the acknowledgment of the United Kingdom's universities and college students.
ReplyDeleteGraphing Ideas is very help to students in their university projects. There are many students who can relate this post and also they want Online Class Help for resolve the academic issues.
ReplyDeleteHarassment is any behavior that is unwelcome, offensive, or threatening and that creates an intimidating, hostile, or abusive environment. It can take many forms, such as physical, verbal, or sexual harassment, and can occur in various settings, including the workplace, school, or online. Harassment can have serious and long-lasting effects on a person's physical and mental health, as well as their ability to work, study, and participate in society. It is important to recognize Is Credit Bureau Systems calling your relatives
ReplyDeleteand address harassment when it occurs and to take measures to prevent it from happening in the first place, including promoting education and awareness, enforcing laws and policies, and providing support and resources for victims.
E-news is a term used to refer to electronic news, which is news content that is delivered and consumed via digital platforms such as the internet, email, social media, and mobile devices. E-news can take many forms, such as articles, videos, podcasts, and social media updates, and it covers a wide range of topics including current events, entertainment, sports, science, and technology.
ReplyDeleteA trench is a long, narrow excavation or depression in the ground, typically deeper than it is wide. Trenches can be dug for a variety of purposes, such as irrigation, drainage, or military fortifications.
ReplyDeleteIn military contexts, Best trenches in USA are often dug as defensive fortifications, providing soldiers with a protected space from which to fire on enemy positions. Trenches were commonly used during World War I and are often associated with the concept of trench warfare.
I had no idea about these fascinating facts before reading this post. I love how nature always surprises me. Your writing style captivated me from the very beginning, and I couldn't put it down until the end! It's amazing how color blind test can impact people's lives so positively. Your post beautifully explained how these tests can help people navigate the world with more confidence, whether it is choosing appropriate clothing combinations or recognizing important traffic signals. This was a truly eye-opening read!
ReplyDeleteThis comment has been removed by the author.
ReplyDeleteGraphing ideas and tools are invaluable across various fields, including nursing. While pie charting in nursing https://place-4-papers.com/nursing-pie-charting/ is a popular visualization method, it's essential to explore a range of graphing tools to effectively convey data and insights. Bar graphs, scatter plots, and line graphs can also play vital roles in research of any subject, enhancing communication and decision-making. Versatility in graphing is key.
ReplyDeleteFor prompt and reliable Local garage door repairs, trust our skilled technicians to get your garage door functioning smoothly. We specialize in diagnosing and fixing a wide range of issues, including broken springs, malfunctioning openers, and damaged panels. Our team is dedicated to providing efficient and cost-effective solutions, ensuring your garage door operates safely and securely.
ReplyDeleteWith years of experience serving the local community, we take pride in our swift response times and transparent pricing. Don't let a malfunctioning garage door disrupt your routine – contact us for expert repairs and restore the convenience and security of your garage today.
Great Post !! Very interesting topic. Check more about this blog. thanks
ReplyDeleteThanks for a marvelous posting! Sure to bookmark this blog. have a nice day!
ReplyDeleteLooking forward to reading more. Great article post. Fantastic. Thankyou so much
ReplyDeleteLot of interesting information here. Thank you for sharing. keep it up
ReplyDeleteThank you for sharing such valuable insights! I run a website that features useful information that complements your work beautifully
ReplyDeleteCollege Brawl APK is praised for its fluid and engaging combat system, which feels modern yet retains the nostalgic charm of classic beat ‘em ups.
ReplyDeleteAppreciate you posting this, worked perfectly for me! Speed up your clicks with this Clicks Per Second Test article. Clicking speed can be a game-changer in digital environments, and CPS Test makes it easy to develop that skill through consistent, stress-free practice in short sessions.
ReplyDeleteI’ve been considering getting IV Therapy at Home for hydration and immunity. Thanks to this article, I found a reliable service here: IV Therapy at Home.
ReplyDeleteThis post makes excellent points. The convenience of a doctor at home can’t be matched by traditional clinic visits.
ReplyDeleteWhile it’s tempting to see and do everything, overexertion can lead to exhaustion and illness. Listen to your body and pace yourself. Schedule rest breaks between sightseeing activities and avoid long periods of continuous travel without downtime. Adequate rest is crucial for maintaining energy and immunity during extended trips. doctor at hotel
ReplyDeleteLove these Graphing Ideas and Tools — they offer simple, classroom‑ready ways to get students engaged with surveys, bar graphs, and meaningful data displays. A great way to bring real, hands‑on graphing practice into math lessons and help students interpret information visually.
ReplyDeletebecome a sonographer
sonography certification